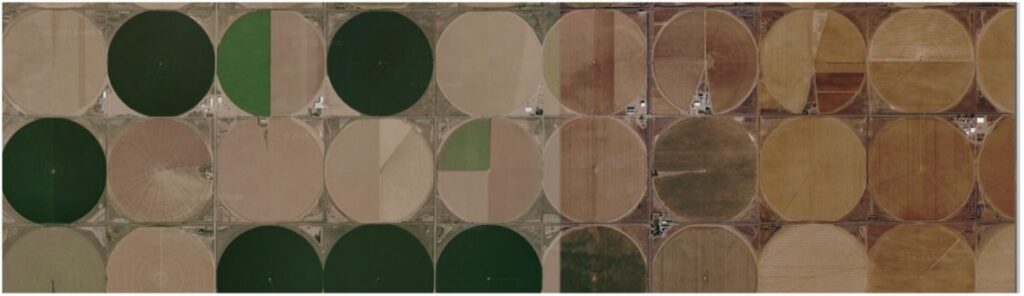
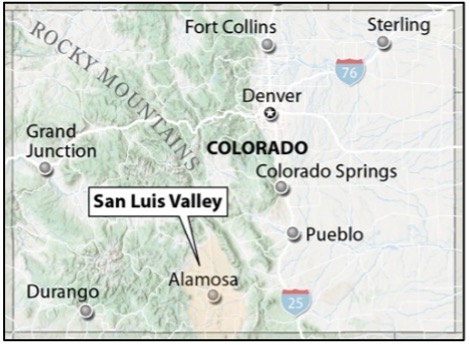
Irrigation, Declining Groundwater — San Luis Valley, Colorado
Regional drought, less winter snowpack, less snow to melt, less aquifer recharge, aquifer depletion, groundwater quality deterioration, water rights complexity, pumping management dilemmas!
Prepared by Andrew Stone, Hydrogeologist (andrewstonewater(at)gmail.com)
In many parts of the world there are water management challenges related to climate change and groundwater pumping in excess of recharge. The San Luis Valley in Colorado is one such area. Other states, such as California, Nebraska and Arizona have irrigation areas with similar challenges of supply & demand mismatch.
The San Luis Valley with an average elevation of 7,000ft above sea level has a cold desert climate with annual precipitation below 8 inches. Prior to settlers arriving in the Valley in the mid-19th century the Kapota band of Ute Indians lived in the Valley. Early settlers recognized irrigation potential and developed stream-fed systems for agriculture. By the 1880s, water conflicts among settlers were occurring and in 1888 there was a General Adjudication of water rights. By the end of the 19th century all the surface water rights had been appropriated. The 8,000 square mile Valley has two major groundwater aquifer systems that have been developed for productive commercial agriculture. By the 21st century declining groundwater levels were causing increased challenges for water management. In this third decade of the century, the declining water availability for irrigation has become more dire.
Geologically, the San Luis Valley is a downfaulted structural basin. There are confined and unconfined aquifers in sediments filling the basin. Between five and one milion years ago the valley contained Ancient Lake Alamosa. Thick layers of sand, gravel and clays developed in the lakebed, and those sedimentary deposits, now identified as the Alamosa Formation, contribute to the hydrogeological complexity of parts of the confined aquifers. The upper unconfined aquifers are separated from the lower confined aquifers by these clay layers. Streams flowing from the surrounding Sangre de Cristo and San Juan Mountains are the principal source of groundwater recharge with spring snowmelt sustaining the streams. Groundwater in the confined aquifers is under pressure, but it was only in the early years that there was artesian flow that reached the surface. tion.
The Rio Grande River flows through the Valley, and diversion ditches have long been a source for irrigation. Groundwater naturally helped sustain river flow, and excess irrigation water from inefficient flood irrigation helped recharge the aquifers. In the 1950’s rural electrification programs and high capacity pumps increased pumping and decreased the volume of groundwater. A 1969 state law required the State Engineer to integrate administration of groundwater and surface water rights to protect senior water right holders. As a response to declining groundwater levels, in 1972 the state declared a moratorium on new wells in the artesian aquifer followed by a 1981 moratorium for new wells in the unconfined aquifer. In 2004, a law was passed (SB04-222) ordering that aquifers in the Valley must be managed for sustainability. An added complexity is that the Rio Grande River is subject to an interstate water sharing compact.
The establishment of local control via groundwater sub-districts was a strategy of SB04-222 designed to achieve agreements on reducing Valley pumping by 20%. Many areas do not have detailed records of past irrigation use. Groundwater pumping metering only began in 2009, and groundwater aquifer models have been used to characterize the aquifer dynamics and quantify needed pumping reductions. Protecting water rights and also maintaining faming viability has led to legal issues among landowners, districts and the state. There are ongoing endeavors to take land out of production to achieve sustainability. “Buy and dry” efforts have made use of use federal programs such as the Conservation Reserve Enhancement Program. Provided there are funds available, recent pioneering initiatives to retire crop circle irrigation by conservation easements may help towards sustainability.

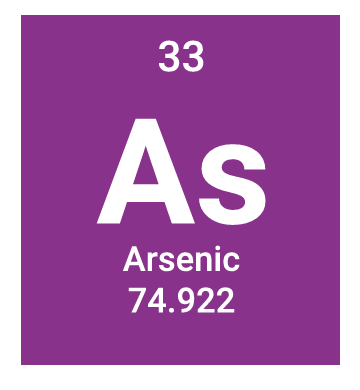
Heavy metals, such as arsenic, uranium, tungsten, and manganese, occur naturally in Valley aquifer sediments. Drilling deeper wells closer to bedrock where heavy metal concentrations may be higher, and having less recharge water available to dilute contaminants has resulted in elevated levels in some wells. Arsenic in irrigation water can stunt crop growth but the main concerns are the negative socioeconomic impacts of contamination in private wells where levels exceed health thresholds.
Worldwide there are groundwater problems because of over pumping and climate change impacts on recharge. San Luis Valley is a representative case study of political and economic challenges resulting from developing groundwater beyond sustainability. Using good science to quantify the geometry and hydraulic characteristics of aquifers is a perquisite for resource management. Achieving agreement among groundwater professionals, landowners, irrigation districts, local government and state regulators about cause and effect, and implementing equable effective solutions, is a Herculean challenge that should be front and center of water policy.
BIG PIVOS: 21st Century Realities Hit San Luis Valley Agriculture | San Luis Valley background
San Luis Valley Drinking Water Heavy Metals Explained – Circle of Blue
Easements for Aquifer Rcover in the San Luis Valley
Ash Meadows, Nevada — A Unique Oasis in the Desert
Complex hydrogeology. Flow system with discharge at Death Valley. Endangered pupfish dependent on springflow. Threatened habitat. Water quality threats from development, nuclear test site and lithium mining.
Prepared by Andrew Stone, Hydrogeologist (andrewstonewater(at)gmail.com)

Ash Meadows is an area in the Amargosa Desert in southwest Nevada with an ecosystem sustained by groundwater. Often described as an oasis in the desert, springs at Ash Meadows are outflows from subsurface water “plumbing” which are part of the Death Valley Regional Flow System. Geologically, Ash Meadows is in the tectonic Basin & Range system of the western US. Earth movements stretching the Earth’s crust in the early Cenozoic Era (60 million years ago) resulted in geological faults producing a series of grabens (basins) and horsts (ranges) between eastern Utah and California.
The groundwater that emerges at Ash Meadows originates as snowmelt from Spring Mountains to the east. At Ash Meadows there are 30 separate springs and seeps with a combined flow of about 10,000 gallons per minute. Groundwater flowing in a southwesterly direction in limestone and dolomite carbonate rocks reaches the surface because of geological fault systems that act as both conduits and barriers to flow. The geological cross section below (modified from US Geological Survey Report, 994079) shows a simplified concept of the springs’ “plumbing system.” The springs were once part of a much larger system of lakes and streams that started to dry up about eleven thousand years ago when the regional climate changed, isolating the fish population.

The endemic Ash Meadows Amargosa Pupfish is found only in the spring-fed streams and pools in the Ash Meadows National Wildlife Refuge. The spring systems are of great ecological significance. The springs include the Devil’s Hole, declared a National Monument in 1952. The Devils Hole Pupfish (Cyprinodon diabolis) is a one inch long critically endangered species that only lives in the upper part of the 400 foot deep Devils Hole cavern. The spring system has been threatened by agricultural development by settlers in the 19th and 20th centuries, irrigation pumping in the 1970s, proposed housing development in the 1980s and more recently, plans for an open pit lithium mine on the margins of the Ash Meadows National Wildlife Refuge. In addition to potential hydrological impacts from climate change, there is a possible future groundwater contamination risk from the upgradient nuclear test site 50 miles away.
For more information and links to videos and websites about the interesting Ash Meadows hydrogeological/ecological system and the politics of threats and protection, just put keywords Ash Meadows Springs or Devils Hole Pupfish into your browser. USGS report 99-4079 is a good source for hydrogeological information.
Fresh Groundwater Aquifers Under Utah’s Great Salt Lake?
Recent research has established that there could be vast freshwater resources
Prepared by Andrew Stone, Hydrogeologist (andrewstonewater(at)gmail.com)
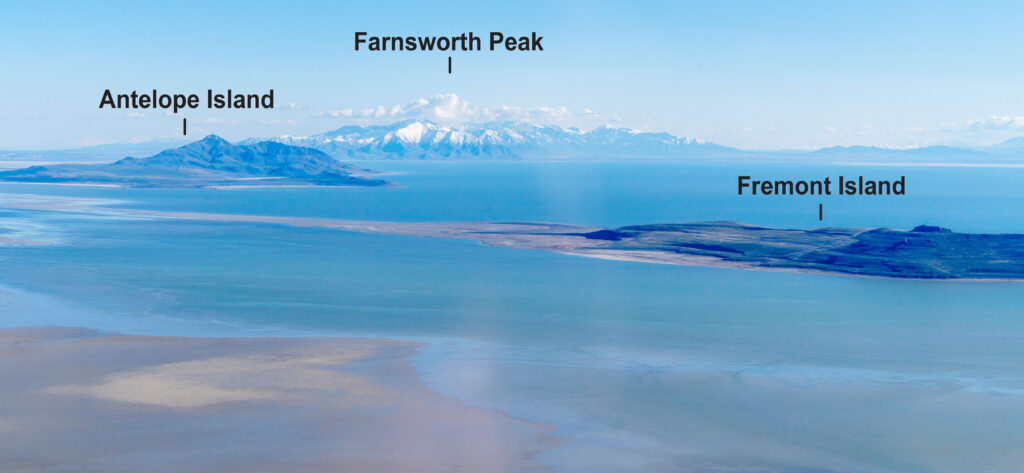
Antelope Island, left in this photograph.] Photo credit: EcoFlight
The 1,500 mile2 Great Salt Lake (GSL) in Utah is the largest endorheic lake (no external drainage) in North America. Geologically, GSL is on the eastern margin of the Basin and Range Province that extends west to California. The Great Basin comprises a series of north-south-trending mountain ranges separated by downfaulted deep sediment-filled basins. In endorheic lakes with no outflowing drainage and high evaporation, water becomes progressively salty.
The GSL today is a small remnant of the 20,000 miles2 Lake Bonneville that existed 15,000 years ago. Over the last 150 years the depth of the shallow GSL has varied by as much as 22 feet. In addition to direct rainfall, the input of water to GSL comes from inflow from rivers and seepage from lake margin groundwater.
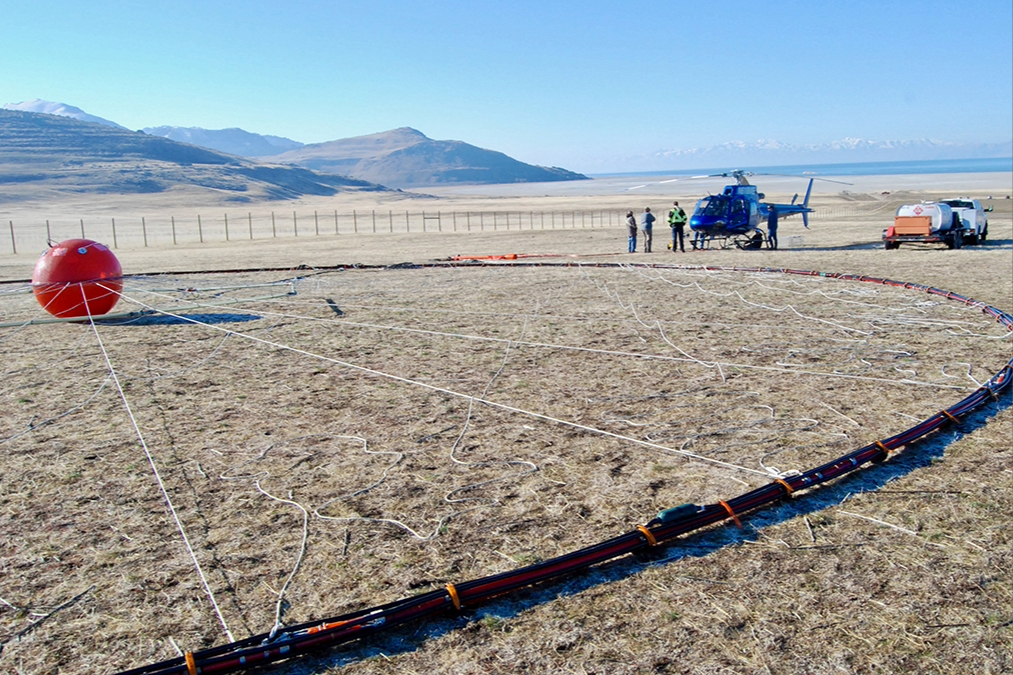
Recent electromagnetic geophysics surveys of the Farmington Bay Area of the GSL by the University of Utah Department of Geology and Geophysics have provided evidence that there could be a considerable extent of freshwater aquifers beneath the GSL. (See report links below). One of the geophysical methods used was airborne electromagnetic (AEM). This measures the electrical resistivity of geology beneath the lake by transmitting electromagnetic fields from instruments flown over the lake by helicopter. Responses to the electromagnetic signals from lake sediments saturated with salt water indicate thin, highly conductive layers beneath the hypersaline lake water. Beneath these layers, the instruments identified layers with more resistant responses to the signals. The differing resistance indicates that the deeper sediments are saturated with fresher water than in layers closer to the lakebed. Freshwater-saturated sediments beneath the lake layer have also been confirmed by water salinity and chemistry measurements from test wells.
(Feb 2025) Photo: Brian Maffly, University of Utah
Geophysics equipment for airborne data-gathering Farmington Bay, UT (Feb 2025) Photo credit: Brian Maffly, University of Utah Geophysics technology can help delineate the geometry, extent, and internal structure of the geology beneath the lake. Previous geological studies have shown that in places there are depths of up to 9,000 feet of sediments below the lake overlying down-faulted basement rocks. If salty sediments over the whole lake are restricted to thin layers in near-surface zones, then the vast volume of sedimentary and volcanic rocks below the lake could potentially be freshwater-saturated.
What are the water management implications in the arid water-short western states of a possible vast GSL aquifer system with freshwater? If there are proven freshwater reserves, there will be economic and environmental issues that will require creative engineering solutions for any large scale water supply development. The State of Utah owns the GSL and presumably any development of water resources would be the state’s responsibility.
However, Farmington Bay is a relatively small area of the GSL and before the current research results can be extrapolated to the whole GSL Basin there needs to be extensive hydrogeological investigation to characterize the basin’s water resource potential. Geophysics is likely to be a key component of more comprehensive research to reveal the geometry and stratigraphy of the basin’s geology. Assessing the potential for groundwater development will also require characterization of recharge and flow systems and modeling of the basin’s hydrogeology and hydrochemistry.
There are recent research findings of extensive freshwater aquifers miles offshore below the seabed on New England’s continental shelf. There are confirmed freshwater aquifers occurring in the Mojave Desert that have been proposed as an augmentation source for Southern California water supply. Results from the Farmington Bay research of the GSL Basin’s freshwater potential would seem to justify investing in more hydrogeological research under the GSL.
Utah Geological Survey website (https://geology.utah.gov/) has many reports on the GSL. Reports on the subject of this article (GSL groundwater) are : Scientific Reports – Open Access, February 2026 (Principal reference) Journal of Hydrology April 2026
Fresh Groundwater Aquifers Under the Sea?
Yes! And there’s lots of it that could be pumped for water supply use on land
Prepared by Andrew Stone, Hydrogeologist (andrewstonewater(at)gmail.com)
An international team of scientists, led by Dr. Brandon Dugan, Hydrologic Science and Engineering Program, Colorado School of Mines, has been researching below the seabed for places where there are geological layers saturated with fresh water! To the right of this page is the logo of the research team, “Expedition 501 New England Shelf Hydrogeology.” The expedition is a joint collaboration between the International Ocean Drilling Programme and the US National Science Foundation. The work of the scientists is to find out where freshwater occurs offshore, quantify how much there is, work out when it got there and then (perhaps) work with coastal water managers to determine if there is an economical way to pump the freshwater onshore for water supply. This project is an exciting groundwater resources research endeavor encompassing the latest science and technology. Updates of all aspects of the project are reported online and should be of broad interest to all water managers and groundwater professionals.
At many places worldwide the locations of coastal submarine freshwater springs close to shore have been known for centuries. For these springs, the source of the freshwater bubbling up from the seabed is from aquifers recharged on land. However, the groundwater that is the focus of the Shelf Hydrology Project is too far offshore to be linked to any current land-sourced supply. The 501 research is building on previous studies, including geophysics surveys, and is focused on mapping the characteristics, dimensions and geometry of the fresh water in offshore aquifers and in determining the mechanisms by which freshwater came to be in continental shelf submarine aquifers.
During the Pleistocene ice ages, sea levels were at times over 300 feet lower than now. The continental shelf was then dry land, and aquifers could have been recharged by precipitation. Perhaps the shelf aquifers were recharged more recently with fresh meltwater under pressure beneath the ice during periods of glacial advances of ice sheets. Expedition 501 research may provide definitive answers.
Drilling in the 1970s provided evidence of freshwater in sediment layers below the New England shelf seabed. An exploratory borehole was drilled over 1,500 feet deep on Nantucket Island, Massachusetts in 1978, as part of the U.S. Geological Survey’s Stratigraphic Test Well project. This well found fresh water in in Pliocene-Pleistocene sand aquifers. In places the groundwater was less than 1,000 mg/L (seawater is 35,000 mg/L). The lenses of relatively fresh groundwater occurred in coarse grained sediments. The groundwater in layers of fine-grained silts and clays had higher salinities. An 850 ft exploration well drilled near Edgartown on Martha’s Vineyard Island in the late 1970s also showed groundwater of varying quality, with freshwater at 475 feet below sea level.
In 2025, Expedition 501 drilled a transect of three wells south of Nantucket. These were drilled from a lift boat through the shelf seabed to depths of 1,500 feet. Detailed logs of the geological layers and the chemistry of the groundwater were obtained during drilling. Over 2,500 feet of sediment cores were recovered for more detailed laboratory work on the hydraulic properties of the sediment, groundwater chemistry, microbiology and noble gas measurements. The cores are now stored at the Center for Marine Environmental Sciences at the University of Bremen (Germany) and all expedition data will be open access. The research results may have application that will assist assessment of the Earth’s many ocean shelf submarine aquifers with potential value as supply sources.
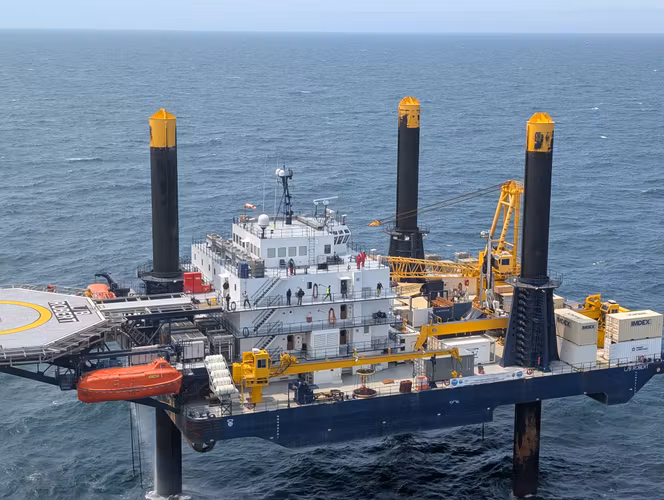
The 180 ft. long lift boat Robert is a self-elevating service vessel. Once in place, the boat is jacked up about 30 feet above high tide level and becomes a drilling platform. photo:
Mowat@ECORD_IODP3_NSFInformation for this Groundwater Picture of the Month was obtained from several internet sources.
Detailed information about offshore groundwater can be reached by browsing Expedition 501 New England Shelf Hydrogeology.
https://www.ecord.org/expedition501/ is the good initial source.
Bank Filtration – Nebraska Teachers Learn About Groundwater Supply
Is water from a well near a river actually groundwater?
Prepared by Andrew Stone, Hydrogeologist (andrewstonewater(at)gmail.com)
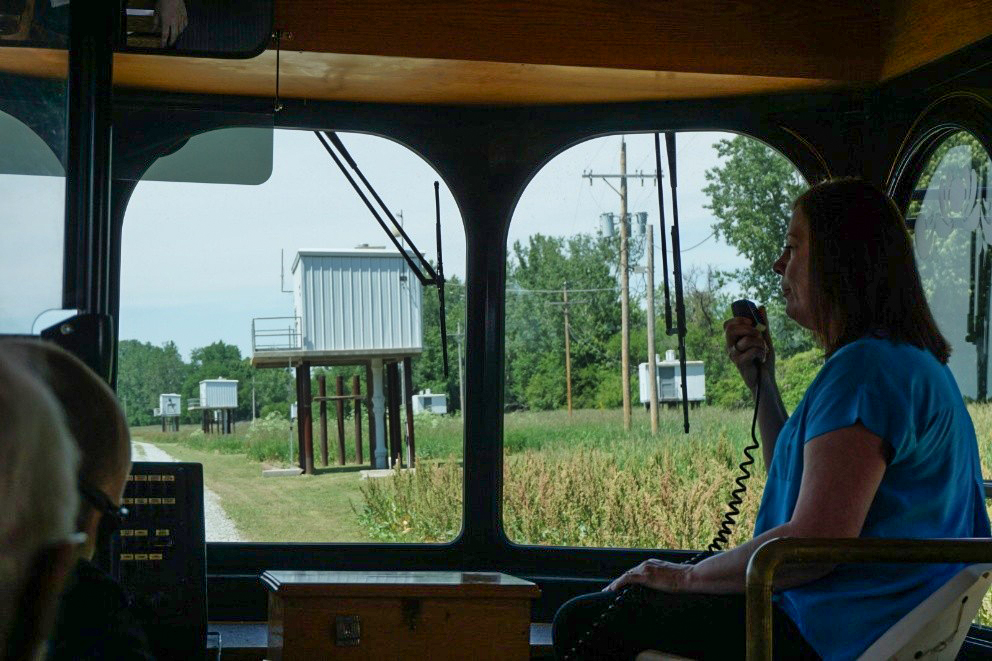
Photo credit: Andrew Stone
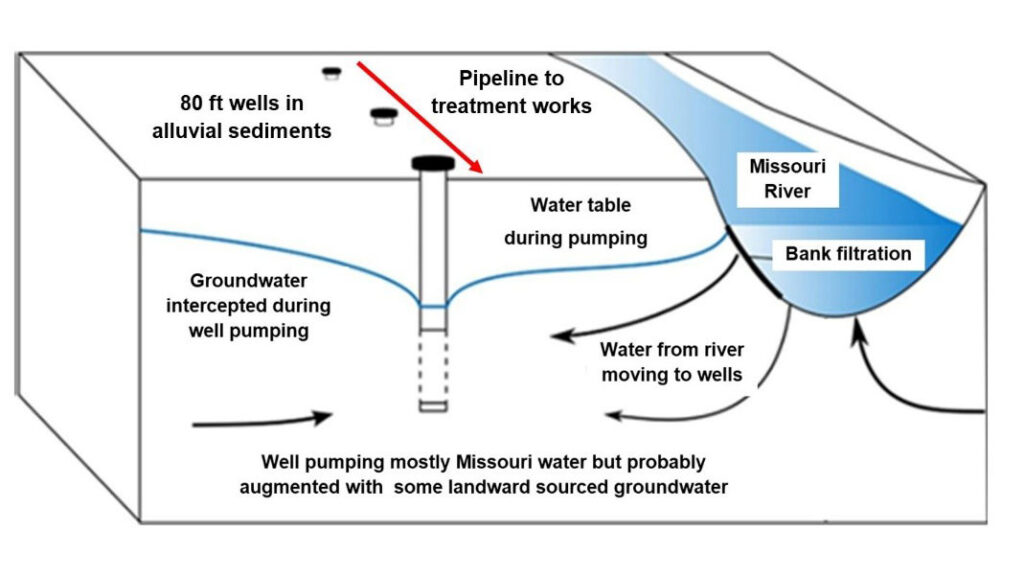
The photograph to the left shows water supply wells close to the Missouri River at Nebraska City, NE. The view from the bus was taken during an American Ground Water Trust field-trip training program for teachers. Water utility staff explain the engineering principle of bank filtration systems. Securing safe reliable water supply and having citizens educated about basic hydrology are both important objectives!
The wellheads of the riverbank wells are raised above flood level with their pumping equipment protected in the “sheds on stilts.” Flood waters typically have high turbidity and increased contaminants. Protecting wellheads is essential for the thousands of vertical wells or collector wells in alluvial sediments close to rivers. Some of the water pumped from riverbank wells may be groundwater that was naturally moving towards the river, but the bulk of water pumped from wells close to rivers is subsurface flow from the riverbed to the aquifer, induced when pumping lowers the water table.
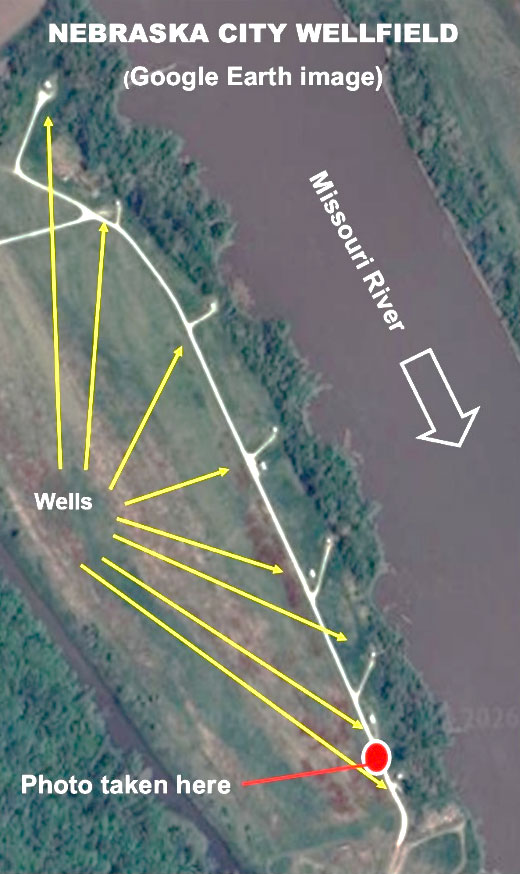
Riverbank filtration, sometimes called riparian groundwater, has been an accepted supply solution worldwide for millennia. Many high capacity systems installed in Europe in the 19th century are still in operation. The US has hundreds of large and small municipal systems that use bank filtration; for example, Louisville, KY, Des Moines, IA, Bismark, ND and Littleton, MA. Many riverbank systems use large diameter “Ranney” wells and some have horizontal well connections underneath the river. The eleven Nebraska City wells are vertical wells in alluvial sediments with a diameter of 18 inches and a depth of 85 feet.
Wells close to surface water are considered to have a risk of contaminants not usually found in true groundwater. The EPA has rules about the treatment of “groundwater under the influence of surface water.” However, water from alluvial wells near rivers requires much less treatment than water pumped directly from rivers. As water moves from the river to the well, chemical and biological processes in the aquifer remove pathogens, nitrogen, synthetic organic chemicals and pesticides resulting in treatment cost savings.
More Information
- RBFsim – A recent paper on Riverbank Filtration (RBF)
- Assessing RBF – Detailed technical information with over 100 references
- Whittman/Layne – Explanation of collector wells
“Tides They Are A-Changin’”,…Groundwater,…Ghost Forests
Prepared by Andrew Stone, Hydrogeologist (andrewstonewater(at)gmail.com)
“Changin” sea levels are impacting groundwater along coasts, estuaries and tidal rivers.
Ghost forests provide dramatic visible evidence of changes in subsurface water quality.
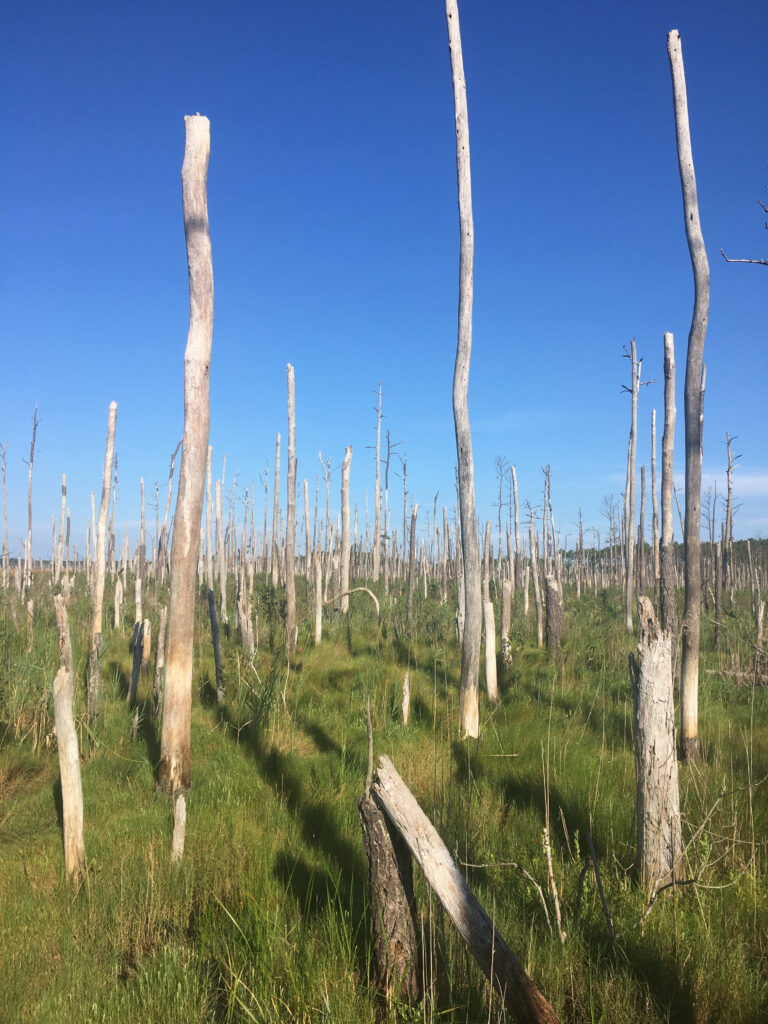
A “ghost forest” of dead trees refers to places where previously healthy trees have died because of increasing salinity in the root zone. The photograph (right) is from the Maryland coast where in places trees have died but remain standing. Rising sea levels can impact subsurface water quality by saline intrusion contamination. Some estimates show current global average sea level rise to be as much as 3mm/year, (about 1/8 of an inch). The dying of trees is a visible manifestation of future economic impacts on infrastructure that are likely to be much greater than the ecological loss of trees as ghost forests.
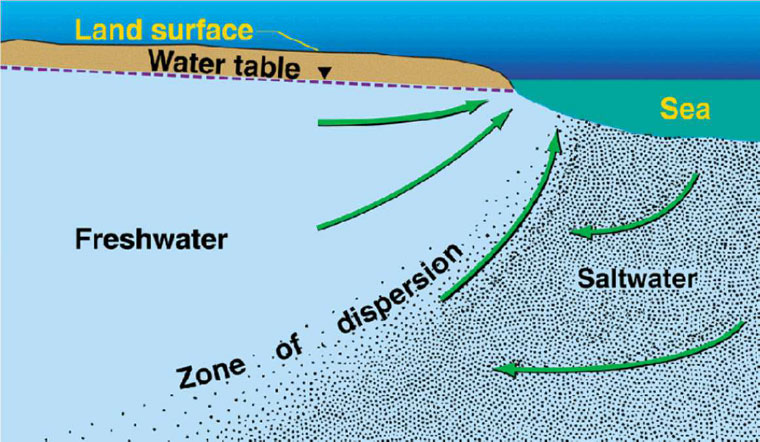
Basic physics and geology explain the intrusion process in coastal aquifers. The subsurface seaward movement of fresh groundwater can prevent saltwater from encroaching on coastal aquifers. The position of the saline/fresh interface in aquifers (zone of dispersion) involves a balance between gravity induced seaward groundwater flow and the sea level baseline. Coastal aquifers can occur in many geological environments provided there is enough interconnected permeability for hydraulic contact between land and offshore. The USGS diagram indicates that impacts of reduced groundwater flow and/or a rise in sea water level baseline will move the boundary zone between saltwater and non-saline water landward, causing saline contamination of groundwater or completely replacing what was preciously fresh groundwater. Storm surges and coastal flooding related to sea level rise can also exacerbate low-lying coastal salinity changes.
Over recent decades, sea levels worldwide have increased relative to the land. Why? A principal reason is rising global temperatures causing thermal expansion of seawater. Changing weather patterns are also increasing the rates of ice melting from the poles and mountain glaciers. In addition, decades of depletion of groundwater from aquifers has added to ocean volume. In some places, land subsidence or geological instability has locally accelerated the landward impacts of saline intrusion.
Some of the challenges for water-related infrastructure will require coastal communities to invest billions of dollars to mitigate the effects of increasing salinity of groundwater and rises in the level of water tables.
- Increasing salinity will result in the abandonment of wells for drinking water supply and irrigation.
- Even if salinity increases are small, there is increased risk of corrosion of pumps and equipment.
- Onsite septic systems could fail if rising groundwater levels impact leach fields in coastal homes.
- Saline seepage into municipal sewer systems could require new treatment processes or relocation.
- Landfills and low lying contaminated areas risk leachate generation from rising groundwater.
- Riparian saltwater intrusion from all tidal waters and any hydraulically connected drainage ditches
- and canals can bring salinity issues many miles inland from the coast.
A huge engineering and planning response is needed for sea level changes affecting millions of citizens in low lying coastal cities. Policy procrastination may turn out to be very costly. Ghost forests are just one “canary in the coal mine” that has already fallen off its perch. It is not a time-distant risk. Has anybody noticed?
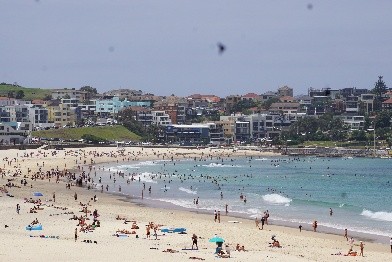
Next time you are relaxing on an ocean beach give some thought to what is happening at the saline freshwater interface below the beach, and ask yourself – where is the “zone of dispersion” and is it moving inland?.
More Information
- Ground Water in Freshwater-Saltwater Environments of the Atlantic Coast, USGS https://pubs.usgs.gov/circ/2003/circ1262/
- Saltwater intrusion and sea level rise threatens U.S. rural coastal landscapes and communities. Link Scholarly article: 2024, O’Donnell et.al.
- Special Report on the Ocean and Cryosphere in a Changing Climate, IPCC https://www.ipcc.ch/srocc/ (Chapter 4)
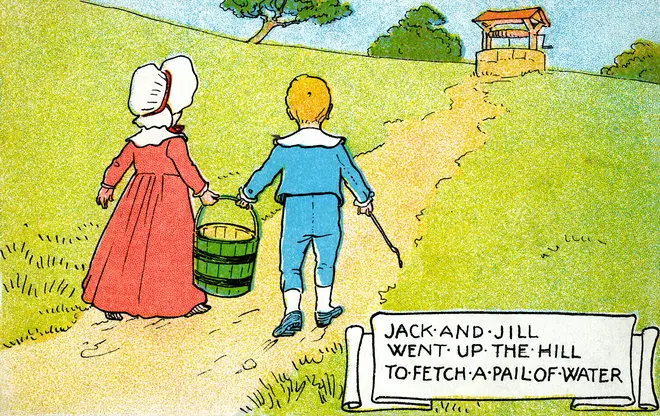
“Jack and Jill went up the hill to fetch a pail of water,
Jack fell down and broke his crown and Jill came tumbling after”
Prepared by Andrew Stone, Hydrogeologist (andrewstonewater(at)gmail.com)
What! – that first line is a great groundwater learning opportunity!
Have you ever realized that for many generations of young children the well-known Jack & Jill nursery rhyme, published in 1795, serves as their first introduction to groundwater! The rhyme provides four subliminal water resources messages:
1 Illustrations of the rhyme typically depicted a well with a rope and bucket. The message: there is water down the well, hidden in rocks and earth below ground level, (groundwater).
- To get the water out of the well there has to be some way to raise the water up to the surface.
In this case, a rope connected to a handle that works by muscle power. [Many 18th and 19th century illustrations show Jack & Jill as young children. However, even if they could reach the handle, lifting the bucket up the well is probably more than small children can manage!]
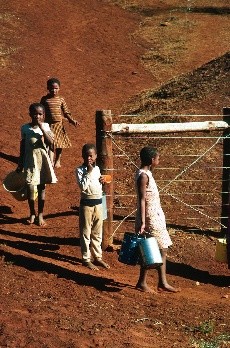
3.Once out of the well and into the bucket, the real work begins because the (heavy) water has to be carried (without spilling) from the well to the home. [For many, but not all, communities worldwide, pumps have transformed the chore of getting groundwater out of the well.]
4.Two-person teamwork may be needed when carrying a heavy bucket to ensure that the precious water arrives safely. [Pipelines have revolutionized “fetching water” although UNICEF reports that 2.1 billion people worldwide do not have access to safely managed water. Children often have “fetching” responsibility.]
The first line of the rhyme has relevance from a water perspective. There are also interesting backstories about the rhyme’s origins and meaning. The names Jack & Jill were typically used in the 16th century as generic names for a man and a woman or boy and girl. Shakespeare uses the names in the plays, A Midsummer Night’s Dream and Love’s Labor’s Lost.
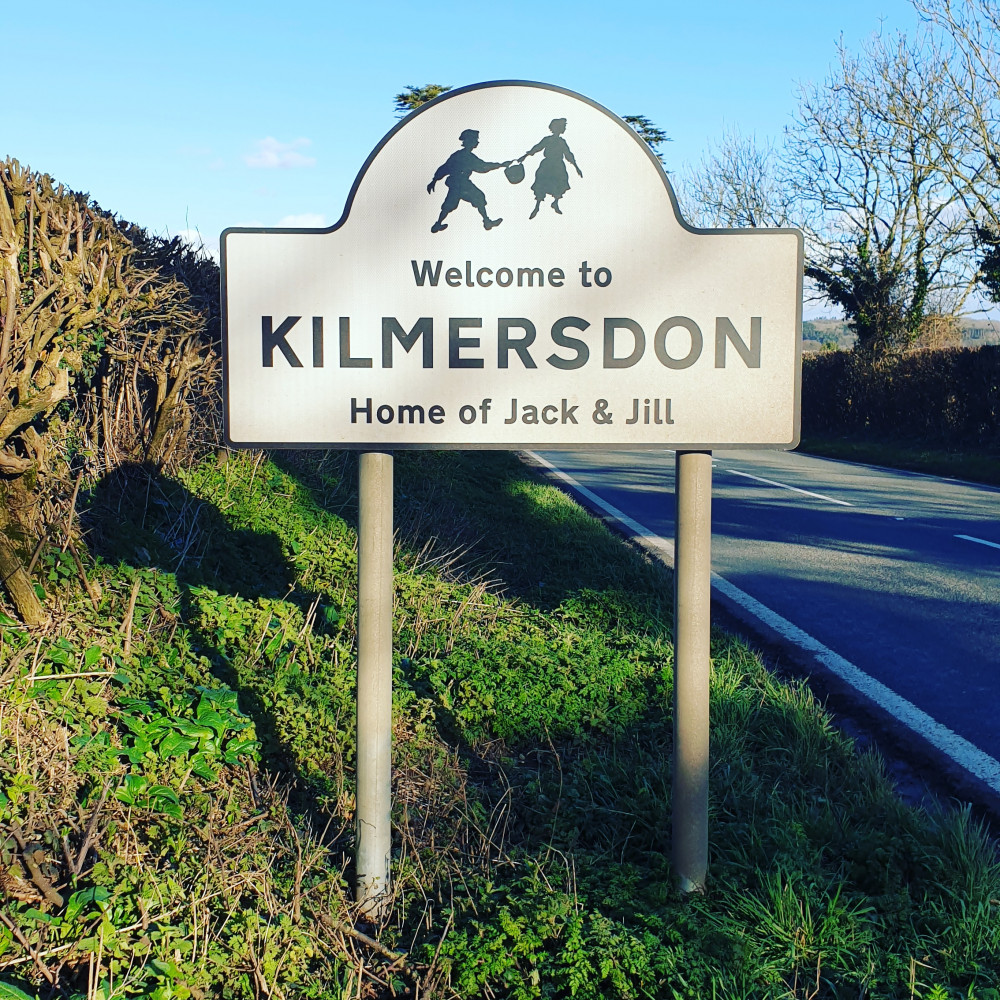
The village Kilmersdon in western England claims to be the place where the rhyme originated. The village has a road sign claiming “ownership.” A local historian, Martin Horler, researched the folklore and gives a date of 1645, when according to legend, Jack and Jill (who are teenagers) climb a local hill called Badstone, and in a quarry at the top, a boulder falls and crushes Jack (broke his crown) and two days later the disaster is compounded when Jill dies in childbirth (came tumbling after). This disaster, (if true and the date accurate!) took place 150 years before the first known publication of the nursery rhyme, giving plenty of time for the words retelling the tragedy to be transformed. The water well origins of the story received supporting evidence in 1999 when an old well was discovered on the top of Badstone Hill in Kilmersdon. This gave the village “proof” that their claim to the origins of Jack & Jill was correct. Archaeologist Dr. Peter Addyman confirmed the 35 foot deep well’s 16th century origins and Kilmersdon doubled down on their claim to be the home of the Jack & Jill story.
A French claim to the rhyme’s origins is that the rhyme, (Jack et Jill la colline ont monté), originates from France’s Revolution. The words describe the demise of King Louis XVI who was guillotined in1793 (broke his crown) and his wife Marie Antoinette, who was beheaded the following year (came tumbling after).
Yet another suggestion of the rhyme’s meaning is that is satirizes England’s King Charles I, who in the 17th century tried to raise money by reducing (“tumbling down”) the volume of a Jack (1/8 pint), of beer or wine while keeping the same tax. The size reduction the gill (1/4 pint) would then come “tumbling after,” (Jack & Gill)
As is the case with many nursery rhymes, the origins of tragedy: “rocks crushing heads” “kings and queens beheaded” “raising taxes on drinks” may refer to real occurrences that are retold in a gentler form.
More Information
- The true meaning of dozens of nursery rhymes is documented and speculated in many publications, for example:
the book “Pop Goes the Weasel, The Secret Meaning of Nursery Rhymes” by Albert Jack, 2009, Penguin Books. - For information about Kilmersdon’s claim to be the “home of Jack & Jill”, go to Wikipedia or any search engine.
- Visit UNICEF for information about global drinking water challenges – https://www.unicef.org/wash/water-scarcity
Water from Owens Valley for Los Angeles Water Supply Includes Groundwater! Tribes Want it Back!
Prepared by Andrew Stone, Hydrogeologist (andrewstonewater(at)gmail.com)
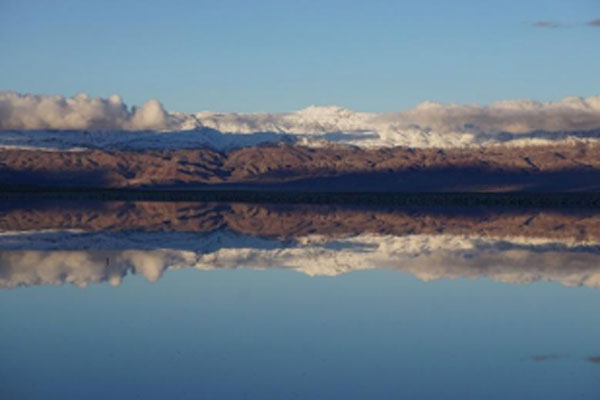
This Owens Lake picture has a groundwater backstory! | photo credit: Andrew Stone
Looks are deceiving! The placid reflections in this photograph of Owens Valley Lake disguise the realities of the negative economic, social and ecological results of “forced” water transfers from Mono Basin and Owens Valley. It is not generally recognized that groundwater is a significant component of the “stolen” water. Since the early 20th century, the Owens Valley and later, the Mono Lake hydrologic system have been systematically commandeered, and their streams, lakes and wetland ecosystems east of the Sierras have been continually deprived of adequate water.
The Owens River Valley is on the northeastern foothills of the Sierra Nevada mountains. Geologic faults and volcanic activity formed the Mono Lake basin over the last 5 million years. [LINK]
For the last 100+ years vast quantities of water have been diverted via pipelines, siphons, canals and aqueducts for water supply 200+ miles away in Los Angeles. Groundwater contributes to the flow of the diverted headwater streams and in addition, groundwater in the Owens Valley hydrologic system is also accessed by wells owned by the City of Los Angeles. In the 1940s, tunnels were constructed north from Owens Valley to the Mono Basin and 1970 a second aqueduct was built that doubled the capacity to divert water south to LA.
An October 18th , 2025, article by the Mojave Desert, journalist Ian James, published in the Los Angeles Times, reports that leaders of the Native tribes in the Owens Valley are asking the city to take less water because current groundwater pumping has dried up the few existing springs and negatively affected meadow vegetation. According to the L A Times article, the Owens Valley “once had so many springs, streams and wetlands that the Paiute and Shoshone people called their homeland Payahuunadü, (the land of flowing water.) Today, tribal members say LA’s extensive use of water has transformed the landscape, desiccating many springs and meadows, killing native grasses and altering the ecosystem.”
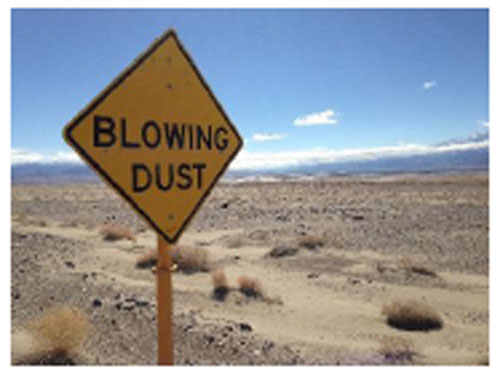
Since 1941 when flow to Mono Lake was diverted, the lake’s surface area has been reduced by over 60%, the lake level has dropped by 45 feet, and the lake salinity has doubled. In the 1970s and 1980s, groundwater pumping in Owens Valley also impacted groundwater dependent natural vegetation north of Owens Lake. Lowered lake levels have exposed dry lake beds at Mono Lake and Owens Valley Lake. Wind blowing the dust from the exposed lake beds causes toxic air quality challenges. Following a 1979 lawsuit by Inyo County and environmental organizations, the City of LA has been required to install dust suppression systems that spray water on the dry lakebed.
It seems ironic that some of the groundwater from wells, and rerouted flow from streams, that formerly maintained vibrant Owens Valley ecosystems, now has to be used for suppressing dust caused by diverting water to Los Angeles.
See the links below for much more information about this hydrological engineering controversy.
The information in this article shows just the tip of a very big (125 year old hydrological & political) iceberg!
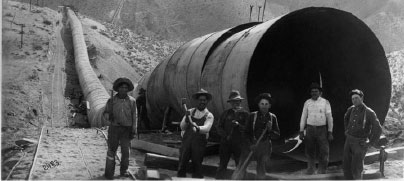
Original aqueduct construction: https://waterandpower.org/museum/Construction_of_the_LA_Aqueduct.html
Mono Craters Tunnel: https://www.monolake.org/today/groundwater-exports-benefit-los-angeles-impact-mono-lake/
1970 Aqueduct: https://waterandpower.org/museum/A_Second_Aqueduct.html Toxic Dust: https://www.plantsciences.ucdavis.edu/news/eviner-nas-owens
2025 LA Times report: Ian James reports for the Los Angeles Times October 18, 2025, with photography by Carlin Stiehl
LA Dept of Water & Power – annual report: https://www.ladwp.com/sites/default/files/2024-06/2024%20Final%20Owens%20Valley%20Report.pdf
What Would Happen if Something Happened to Your Drinking Water Supply?
Prepared by Andrew Stone, Hydrogeologist (andrewstonewater(at)gmail.com)
A “Sole Source Aquifer” (SSA) refers to a groundwater source (aquifer) that is a main source of drinking water for a designated area. The United States Environmental Protection Agency (EPA) defines a SSA as an aquifer supplying at least 50% of the drinking water consumed in the area overlying the aquifer. Sometimes the boundaries of the SSA include recharge areas that may lie beyond the actual aquifer. SSA designation is intended to protect drinking water supplies from overuse and contamination. There are regulations and land-use restrictions for SSA zones to reduce risks of the loss of water source inventory.
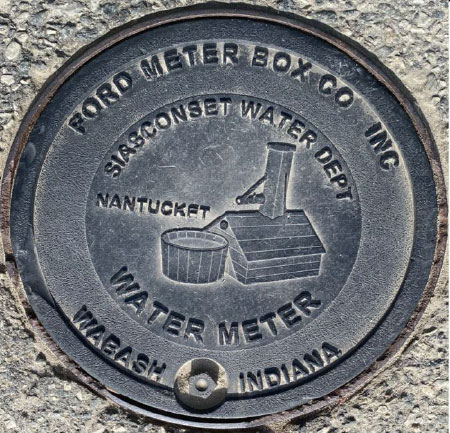
The declaration of a SSA is particularly important where losing an aquifer because of contamination could lead to negative economic consequences and huge engineering costs to bring in a replacement safe alternative water supply. The EPA has authority under the 1974 Safe Drinking Water Act to determine SSAs. There are 76 Federally designated SSAs in the USA. Some examples are: Eastern Snake River Plain (ID), New Jersey Coastal Plain,(NJ), Cape Cod, Nantucket & Martha’s Vineyard, (MA), Long Island, (NY), Edwards Aquifer,(TX), Biscayne Aquifer, (FL), Dayton Buried Valley, (OH), Tucson – Santa Cruz & Avra Basin, (AZ), Columbia and Yorktown Aquifer, (MD).
In addition, tens of thousands of communities have source water protection regulations for drinking water. “Watershed protection” road signs serve to remind citizens about the value of safe dependable drinking water. Here is brief background information about just four SSAs with links to more information.
Dayton, OH

A buried valley filled with glacial sediments is the sole source aquifer system that serves over 1.5 million people in the Dayton Ohio area. The sands and gravels deposited by meltwater from glaciers over 10,000 years ago are in some places 300 feet thick. Over much of the valley-fill aquifer the water table is close to the surface, making it vulnerable to the risk of surface contamination.
Edwards Aquifer, TX

The Edwards Aquifer is the source of water for about two million people in Texas, including the city of San Antonio. Artesian wells, and the springs where water emerges from the aquifer are vital for drinking water supply and ecology. The aquifer is made up of porous and permeable limestones that reach depths of 300 to 700 feet. The limestones are broken by faults and joints, making the aquifer recharge zone vulnerable to contamination. Because of regional tilting of the rocks millions of years ago, the limestones are exposed at the surface in some places (recharge zones) and in others are buried beneath layers of sediments (artesian zones).
Cape Cod Aquifer, MA
The aquifers of Cape Cod and the islands are comprised of sand and gravel deposits left behind by melting glaciers 15,000 to 20,000 years ago. The glacial sediments range in depth between 200 and 600 feet. The aquifers are recharged by rain and snowmelt, and because the sediments are permeable there are very few rivers or streams. Provided that there is not too much pumping, rainfall recharge maintains a “mound” of fresh groundwater that prevents seawater from migrating to inland wells. Managing SSAs in coastal areas involves closely monitoring water quality and restricting pumping in times of drought.

Cape Cod Aquifer, MA

This SSA covers over 10,000 square miles in Idaho between Wyoming and Oregon. The main aquifer comprises volcanic basalt rocks recharged by precipitation and surface steams. Because of past overuse by pumping, the whole aquifer is now carefully managed to increase recharge and reduce pumping. Sustainable irrigation for agriculture is of great economic importance, and the aquifer is also the sole source of drinking water for 300,000 people in eastern Idaho.
How About Walking Down to the Bottom of a Well With Your Bucket to Fetch Water?
Prepared by Andrew Stone, Hydrogeologist (andrewstonewater(at)gmail.com)
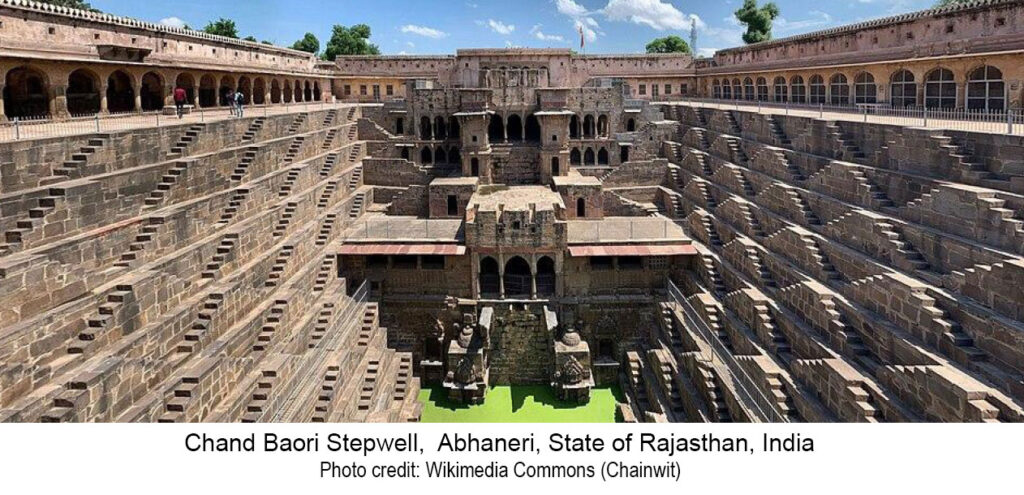
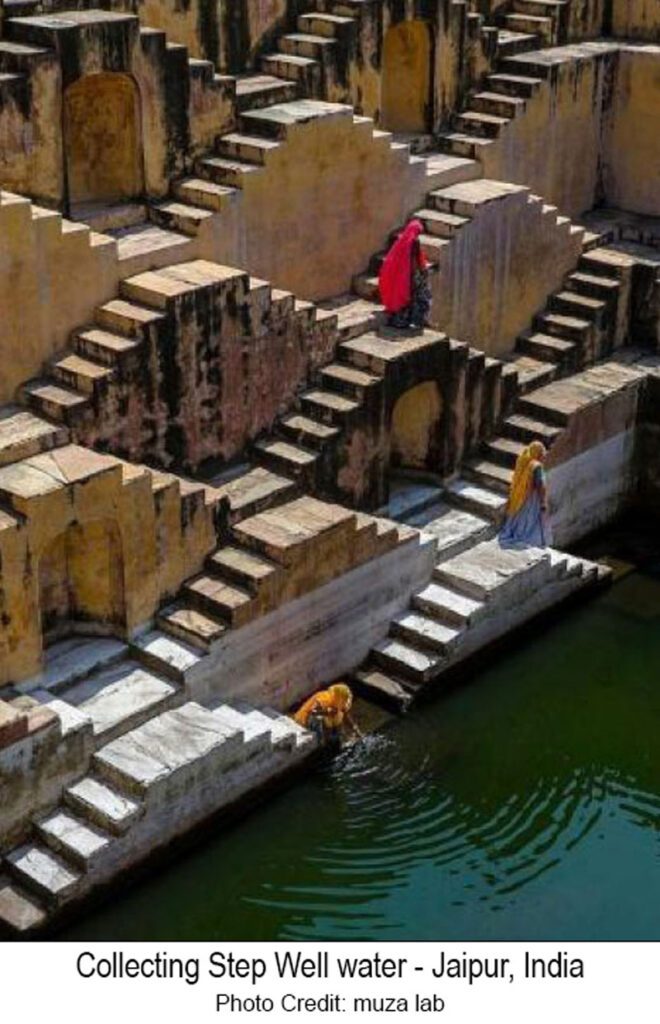
Did you know that there are over 3,000 stepwells in India with many others in arid countries? Water wells are typically constructed or drilled as simple vertical shafts. However, a stepwell is a large diameter excavation constructed to reach permanent groundwater. Access to the wellwater is via a series of stone steps down from the surface to the well water. At a time of low groundwater, it takes several staircases of steps down to reach the water level.
Locally known in India as baoli, the primary purpose of stepwells is to provide year-round availability for water, especially in arid and seasonally arid areas. To make groundwater available year-round stepwells are excavated to a depth just below the lowest expected groundwater level (water table). Steps in a series
of staircases allow people to walk down to reach the water. As the groundwater level rises in the well,
(in India, often as a result of seasonal monsoon rains) the lower steps become submerged and less staircases are used to reach the water.
The picture above shows the 100 ft deep Chand Baori stepwell. (The green color is the water!). The well was constructed in the 8th and 9th century and has a total of 3,500 steps in thirteen levels of stone staircases.
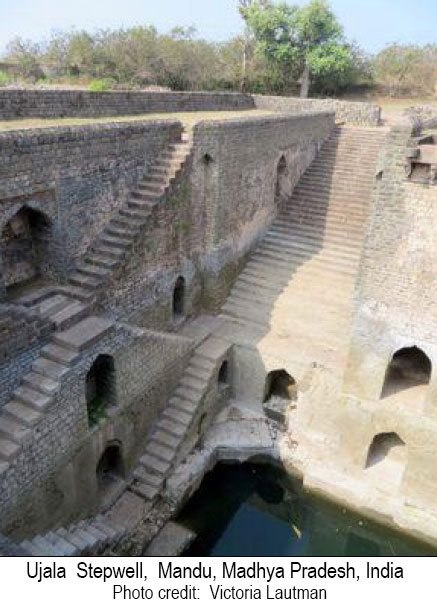
The picture on the left is of the 15th/16th century stepwell called Ujala. It has a less-complex design than Chand Baroi but operates on the same principle.
Stepwells had the primary secular purpose to supply water. However, over the centuries many took on additional significance that led to elaborate architecture and carvings to honor different religions and to give recognition to the dynasties and sultan rulers who financed the stepwell projects.
Still on the subject of history, during the 19th century when India was part of the British Empire, stepwells were decreed by colonial authorities to be unhealthy, and water supply was provided by drilled wells. Many stepwells were then closed and some were filled in, fell into disrepair or became dumps.
Fast forward to the 21st century, and with increasing population, increasing aridity and monsoonrain uncertainty, water managers in India have to consider all options. Many stepwells in India are now being cleaned out and recommissioned to augment supply sources. For example, groundwater is now restored as a supply source at stepwells in Jodhpur (Toorji ka jhalra stepwell) and in Rajasthan, (Moosi Rani Sagar stepwell).
Search the web for many sources of more information about these fascinating constructions that access groundwater. Wikipedia is a good starting point. Also, visit Stepwell Atlas for an interactive map of world stepwells. [Note – the two stepwells listed in the United States don’t function as traditional stepwells!]